Machine learning is not the ideal tool for time series forecasting for a number of reasons, but, as I will demonstrate it in a future post, limited models can be built for short-term forecasting exercises. One aspect of time series data is, however, that you can’t split your observations randomly into train and test subsets: you train on an early interval and test on a later one. Standard ML libraries, such as scikit-learn, don’t provide a tool for that. This post will show how we can split time series data for a machine learning model.
Splitting data between training and testing for time series is different from cross-sectional data as the underlying population is not a set of different individual units but the same observable thing(s) in different time periods. The model is trained on an early part of the observed period and we want to test it on the more recent interval. This assumes a few things, first and foremost the persistence of the patterns over time, but this is not only critical for ML modeling. Standard time series analysis methods, let them be stochastic or non-stochastic, also assume this kind of persistence.
I am planning a longer post on demonstrating the viability of ML in time series predictions, but before that I’d like to show a simple solution to the train-test-split problem when the split cannot happen randomly. I am using a set of macroeconomic variables to forecast the development of Case-Shiller Home Price Index, where I also want to illustrate the importance of domain knowledge in the modeling exercise.
The data is coming from FRED, the St. Louis Fed Economic Database in a csv file. Since feature engineering is best done in pandas, the input object for the train-tests-split method is also a pandas data frame. The method’s extra output beyond the subsets is the list of feature names.
import numpy as np
import pandas as pd
import datetime

hp = pd.read_csv("house_price_changes.csv")
hp.head()

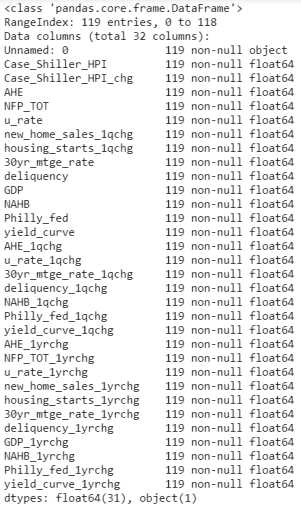
The first column should be the date column, but the csv downloaded from FRED does not have either the proper name or the proper format. Looking at the schema tells us that we have 32 variables, 119 periods and our data starts with an unnamed ‘non-null object’, which should be the date column.
hp.info()

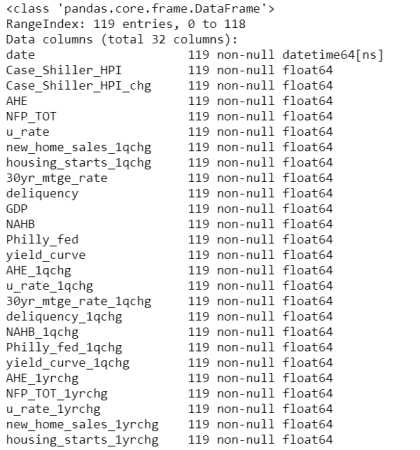
Using the datatime.date() function we can transform the uninterpretable mess into a neat date variable.
hp.rename(columns={'Unnamed: 0': 'date'}, inplace=True)
hp['date'] = pd.to_datetime(hp['date'])
hp.info()

The easiest way to split a dataframe by column values is using a mask. For instance if we want to split our data for dates before and after (not before) January 1st, 2013 we can simply say:
mask = hp['date'] < datetime.date(2013,1,1)
hp_train = hp[mask]
hp_test = hp[-mask]
To get things organized we’d better write a function to train-test-split our dataframe and to get the feature names accordingly. We need the following steps:
- Split to train and test.
- Drop the date column if it is not a feature in the model.
- Split both train and test to X (features) and y (target).
- Get the list of column names.
- Convert the two X and y dataframes to arrays.
def train_test_split_timeseries(input_dataframe, target, timecolumn, year, month, day, dropdates = True):
    """
    The function splits a dataframe containing a time series into non-random train and test subsets.
    The last observation in the train data is the latest datetime value in the data which precedes
    the breakpoint given by the (year, month, day) value. The first observation in the test data is the
    breakpoint given by the (year, month, day) value or the first observation afterwards.

    Parameters:
        input_dataframe (Pandas dataframe): The data file with the time series data.
        target (string): Name of the target variable in the input dataframe.
        timecolumn (string): The name of the time colummn for splitting the dataframe (usually a date column).
        year, month, day (int): The year, month, day components of the breakpoint.
        dropdates (boolean): Whether or not to drop the date column to produce the train/test data. Defaults to True.

    Returns:
        X_train (array): A numpy array of training input data.
        y_train (array): A numpy array of training target data.
        X_test (array): A numpy array of test input data.
        y_test (array): A numpy array of test target data.
        feature_names (list): A list of feature names used in the input matrix.
    """

    # Split to train and test periods.
    model_df = input_dataframe
    target = target
    timecolumn = timecolumn
    mask = model_df[timecolumn] < datetime.date(year,month,day)
    model_df_train = model_df[mask]
    model_df_test = model_df[-mask]

    # Drop date column if dropdates = True
    if dropdates:
        model_df_train = model_df_train.drop(['date'], axis=1)
        model_df_test = model_df_test.drop(['date'], axis=1)

    # Split both train and test to X (input) and y (target)
    X_train = model_df_train.drop([target], axis=1)
    y_train = model_df_train[target]

    X_test = model_df_test.drop([target], axis=1)
    y_test = model_df_test[target]

    # Get column names for variable importance
    feature_names = list(X_train)

    # Convert X_train, X_test, y_train, y_test to numpy arrays
    X_train = X_train.as_matrix()
    X_test = X_test.as_matrix()
    y_train = y_train.as_matrix()
    y_test = y_test.as_matrix()


    return X_train, y_train, X_test, y_test, feature_names
We can now put the function in use. In this particular exercise the target variable is the quarterly change of the Case Shiller Home Price Index (‘Case_Shiller_HPI_chg’), the last period in the train set is Q4 2012, and the first period in the test set is Q1 2013.
X_train, y_train, X_test, y_test, feature_names = train_test_split_timeseries(hp, 'Case_Shiller_HPI_chg', 'date', 2013, 1,1)
When applying the function we get the following output objects.
print('Feature_names')
print(feature_names)
print()
print("X_train type:", type(X_train), ", shape:", X_train.shape)
print("y_train type:", type(y_train), ", shape:", y_train.shape)
print("X_test type:", type(X_test), ", shape:", X_test.shape)
print("y_test type:", type(y_test), ", shape:", y_test.shape)

Now we have our train and test subsets for time series forecasting. The model will be trained on the first interval. The patterns learned on this interval will then be projected to the second interval to test the model. This is what I will show in the next post.
Codes are at the usual place.